The Mandelbrot Set, Part 1: Overview
Recently, I have been experimenting with the Mandelbrot set. I made a video where I showcased a simple Mandelbrot explorer, written in C++ and OpenGL. In this little series I want to explain what the Mandelbrot set really is, how to generate it, and how to program it in OpenGL!
What is the Mandelbrot set?
The Mandelbrot set is a set of points, which are determined by a simple iteration. For a certain amount of iterations, this equation is repeated for each points in the set and coloured appropriately.
The iteration is

where z and c is a complex number, and c is chosen according to the point in the set. The difficulty is that z and c are complex numbers. If they were not, we would not have this much variety in the Mandelbrot set.
A complex number consists of two parts, a real and imaginary part. They form an extension to the real numbers, and solve the awkward case of taking the square root of negative numbers. They are written by summing the real and imaginary part:

where i is the imaginary number and defined as

You see that the number i does not really exist. That is why it is called the Imaginary Number.
When plotting complex numbers, the x-axis represents the real part, and the y-axis represents the imaginary part. In this way, numbers are more like points on a surface or two-dimensional vector.

Similar to that, the Mandelbrot set is also a plot of each point on the graph, where the aforementioned iteration does not diverge.
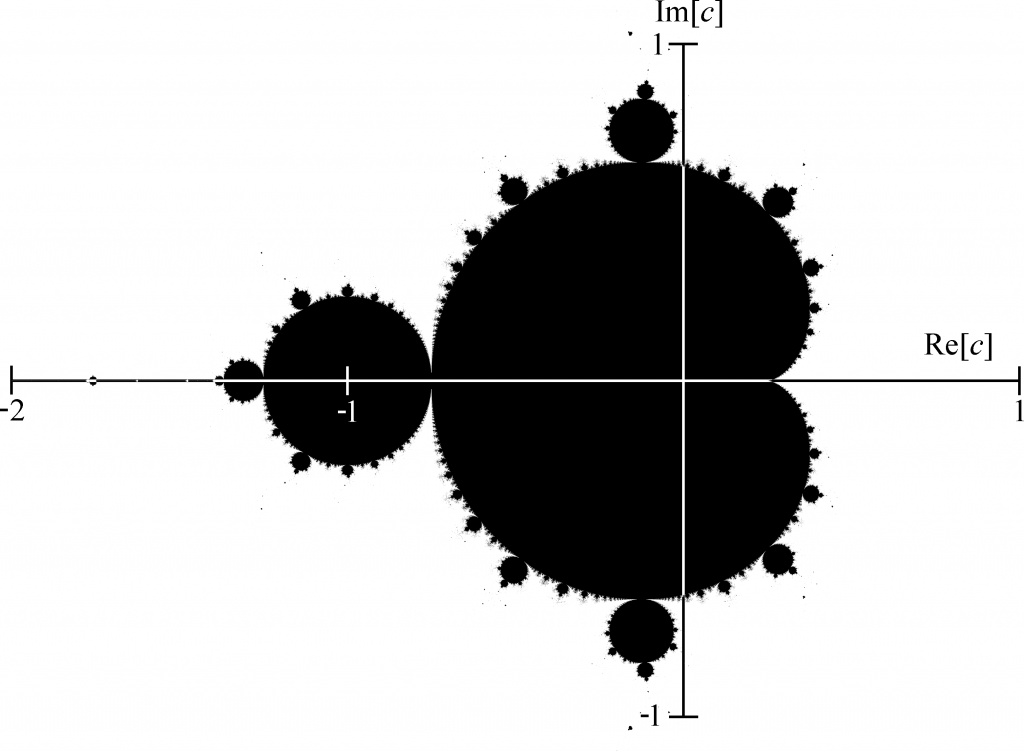
By looking at the graph, you may notice that c in fact is very small and lies close to the origin. We have to keep this in mind in order to render it correctly later on.
Additionally, all points in the set do not have an imaginary or real part greater than 2. We can use this fact to determine whether a point has escaped the Mandelbrot set. Given that, one has only to compute the absolute value of z, which is

Implementing an algorithm
It is very easy to program the Mandelbrot set. In the following you will see some pseudo-code that I mostly wrote to be easy to understand. If the concept has not clicked yet, maybe now it will!
for each pixel (x, y)
    /* Initialised to zero */
    z = 0
    /* Needs to be scaled as to fit the Mandelbrot scale */
    c = map_to_relative(x, y)
    iterations = 0
    while(iterations < max_iterations)
        /* The equation */
        z = z^2 + c

        /* Break if bailout value reached */
        if abs(z) > 2.0
            break
        iterations++

    /* Choose colour depending on how many iterations were needed */
    color = map_to_color(iterations / max_iterations)
    plot(x, y, color)
Colouring
Methods of colouring the Mandelbrot set vary a lot. In general, you must use a palette and colour each point depending on iterations taken (iterations / max_iterations). In the pseudo-code that is the map_to_color function.
For example, if you want to colour the Mandelbrot set in gray-scale, you may write something like this.
vec3 map_to_color(double t)
{
    return vec3(t, t, t);
}
In this way the RGB components scale linearly with t, resulting in a smooth black-white graph.
I hope I helped you grasp the general concept of the Mandelbrot. In the next part I will go on about how to implement this algorithm in OpenGL.